
Big‑data analytics and AI are becoming essential in semiconductor manufacturing. However, the real challenge is not data collection, it is having data that is ready for engineers and systems to consume, analyze, and act on at scale. As Jon Holt from PDF Solutions noted at the PDF 2025 Users Conference:
“How do we handle this hockey‑puck curve of data, bringing it all together from the different silos, at the scale and with the performance needed to achieve real results?”.
Among the many data types generated in semiconductor fabs, Fault Detection and Classification (FDC) stands out as one of the most critical, and most challenging, sources for process control and yield analysis. FDC is widely used to monitor tools and keep process parameters within specification. At the same time, FDC tool trace data directly captures how equipment behaves during wafer processing and often shows strong correlation with yield and electrical test results.
The challenge is that FDC data is high‑volume, high‑frequency, and complex, making it difficult to manage and analyze effectively. Without an analysis‑ready FDC data foundation, it is hard to apply FDC data reliably to yield root‑cause analysis, automation, or AI‑driven applications.
This article explains why analysis‑ready FDC data is critical for yield root‑cause analysis, how it helps uncover yield and e‑test issues that inline measurement alone cannot explain, and how it enables AI applications that can be trusted in production environments.
Note: In this article, FDC data refers specifically to time‑series tool sensor traces that capture chambers and equipment behavior during processing.
1. What Is FDC Data in Semiconductor Manufacturing?
FDC equipment trace (ET) data consists of time‑based sensor signals collected from semiconductor equipment during wafer processing. These signals, such as pressure, temperature, gas flow, RF power, motion, and timing, capture how a tool actually behaves while executing a recipe.
During each process run, tools continuously generate sensor data that reflects their real operating state. When combined with process context such as tool, chamber, recipe, and step information, these signals form a detailed record of how the process was executed, not just whether it completed successfully.
This intrinsic view of equipment behavior makes FDC tool trace data a foundational source for understanding process stability, monitoring variation, and linking equipment behavior to downstream yield and electrical performance.
2. Why Does FDC Matter in Chip Manufacturing?
Semiconductor manufacturing is fundamentally process‑driven. Device performance, yield, and reliability depend not only on design intent, but on how consistently and precisely each wafer is processed across hundreds of tightly controlled steps.
FDC tool trace data matters because it provides direct visibility into the manufacturing process itself. While downstream measurements reveal process results, tool traces capture the physical conditions under which those results are created from pressure stability, thermal response, gas delivery behavior, RF characteristics, and timing on every run.
Many yield and parametric issues do not begin as sudden failures. Instead, they often originate from small, gradual changes in tool behavior: slow drift, chamber‑to‑chamber mismatch, degraded control response, or changes introduced after maintenance. These shifts may remain invisible to alarms and inline measurements for extended periods, yet they accumulate and eventually impact yield or electrical performance. FDC tool traces are often the earliest place where these changes can be observed.
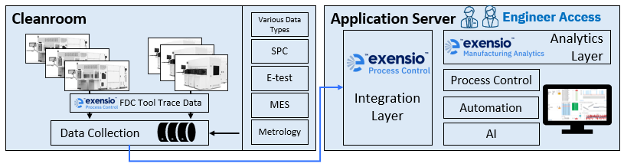 Picture 1. FDC Data Collection and Application Data Flow
As fabs operate at higher volume and complexity, with products spanning multiple tools, chambers, and vendors, FDC provides a consistent, data‑driven way to compare equipment behavior and systematically identify sources of variation.
3. How Is FDC Traditionally Used for Tool Control?
Traditionally, FDC systems are used to monitor equipment behavior in real time and detect abnormalities using predefined indicators. Rather than analyzing full sensor waveforms for every run, engineers typically rely on summary indicators calculated from specific time windows within each recipe step.
These indicators are derived from raw tool traces using statistical operations such as mean, maximum, minimum, standard deviation, slope, or stability. Each indicator is compared against historical baselines or control limits that represent normal tool behavior.
During production, traditional FDC answers questions such as:
- Is chamber pressure within the expected operating range?
- Is RF power stable during the process step?
- Does gas flow follow the expected ramp and settling behavior?
- Are temperature responses consistent with qualified conditions?
When an indicator exceeds its limits, the system triggers an alarm, which may result in flagging wafers, notifying engineers, or holding the chamber. In this role, FDC serves as a tool protection and process stability mechanism, ensuring that processing remains within qualified operating windows.
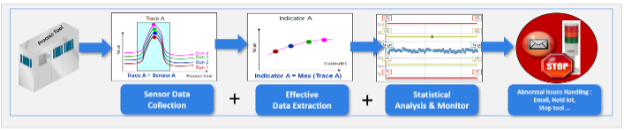 Picture 2. FDC Indicator Generation and Control Overview
4. How Can FDC Be Used to Trace Yield and E‑Test Variation?
While alarm‑based FDC is effective for catching clear deviations, many yield and electrical test shifts originate from subtle process changes that do not violate any single control limit. Pressure drift, RF instability, gas flow variability, temperature offsets, or chamber mismatch can persist quietly and only later appear as CD shifts, parametric movement, or yield loss.
FDC indicators derived from tool traces capture these changes well before they become visible downstream. By correlating FDC data across tools, chambers, time periods, and affected lots, engineers can identify patterns such as:
- Chamber matching gaps driving systematic electrical test shifts
- Sensor or control drift leading to long‑term parametric movement
- Gradual degradation in process stability associated with random yield loss
- Process signatures that distinguish healthy wafers from problematic ones
FDC does not replace other yield analysis methods but complements them. When used as part of routine yield investigation, FDC provides an upstream view that connects intrinsic process behavior directly to product outcomes.
5. How Can Exensio Help Identify Yield Variation Root Causes Using Analysis-Ready FDC Data?
Exensio Yield Aware FDC extends the value of traditional FDC systems by enabling engineers to use FDC indicators not only for monitoring, but as a data source for yield and parametric analysis. Indicators generated in Exensio Process Control are structured, traceable, and analysis‑ready, making it straightforward to correlate equipment behavior with downstream responses such as electrical test, inline metrology, or defect data.
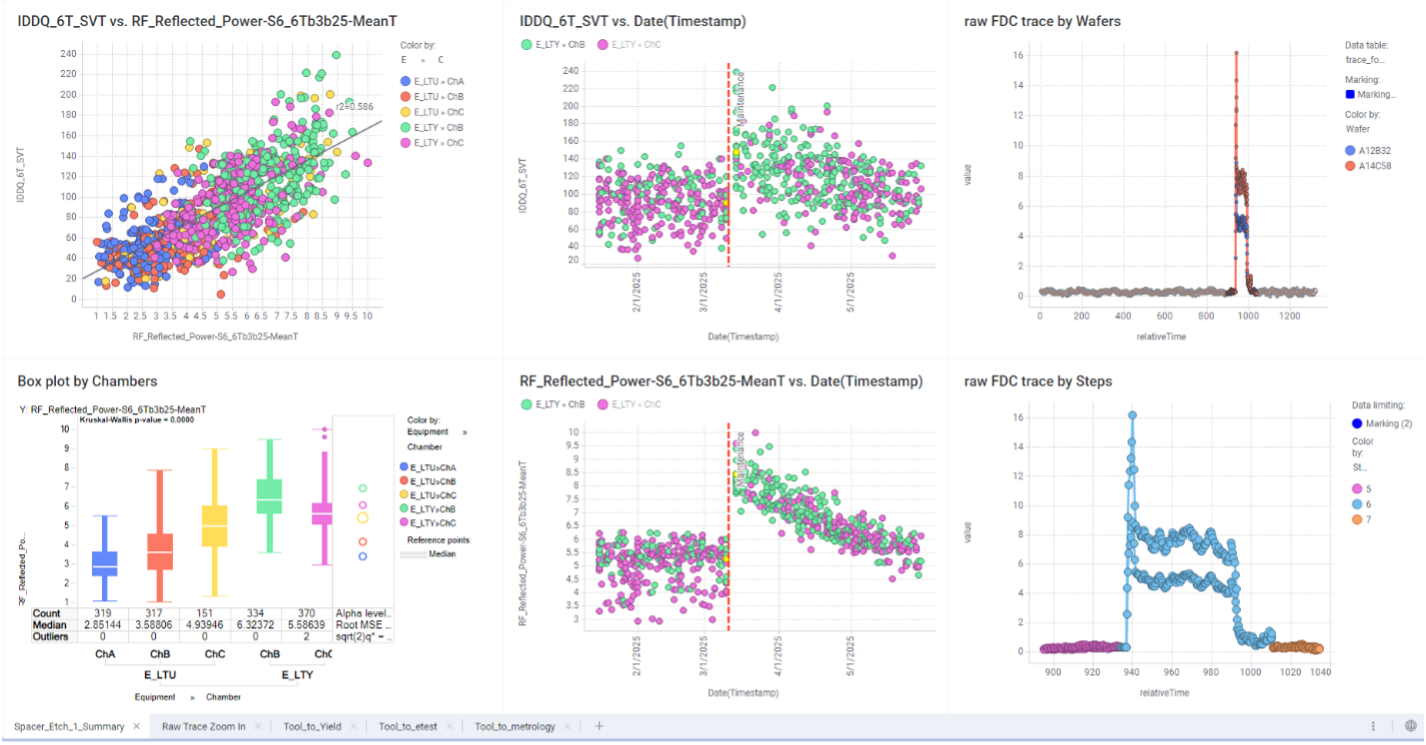
In one customer case, engineers combined FDC indicators with electrical test results and ranked correlations across multiple parameters. This immediately revealed a strong correlation between transistor leakage current and a reflected power indicator from a specific spacer etch step. Instead of searching broadly across the process flow, the investigation was narrowed within hours to a single tool signal and process module.
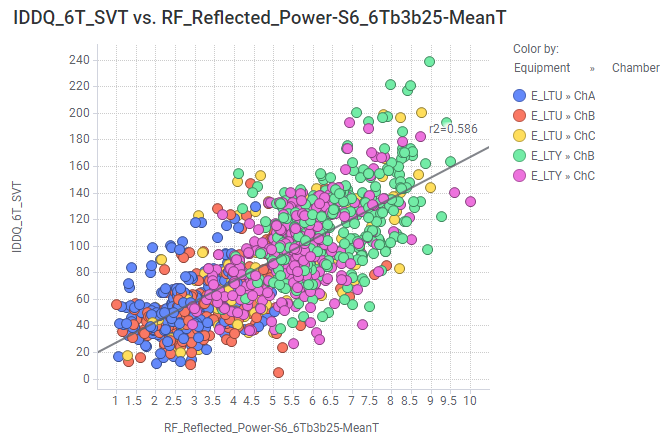 Picture3. Example of Correlation between Spacer Etch Reflected Power and Transistor Leakage Current.
Once the correlation was identified, engineers used Exensio’s integrated workflow to perform time‑trend analysis on the reflected power indicator. The trend showed a clear upward shift that began immediately after a routine preventive maintenance (PM) event. From there, engineers drilled down directly from the indicator trend into raw FDC tool traces, comparing sensor behavior before and after maintenance.
Inspection of the raw traces revealed that both the spike region and the steady‑state region of the reflected power signal had shifted upward, indicating a systematic process change rather than random noise. Because the indicator was physically meaningful and well aligned with the process step, engineers could interpret the signal behavior and form concrete hypotheses about changes in chamber or plasma conditions introduced during PM.
This insight enabled targeted corrective actions, including tightening SPC specifications on related sensors, modifying maintenance procedures, adding seasoning runs, and explicitly verifying FDC signal stability before returning the chamber to production. Importantly, these actions were driven by data, not trial‑and‑error.
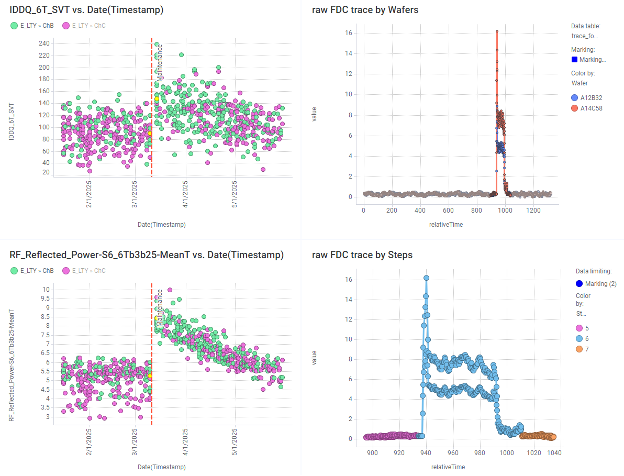 Picture 4. Example of Time Series Change and Raw Sensor Trace Extraction in Exensio
Beyond individual cases, Exensio provides built‑in analysis templates developed from PDF Solutions’ experience across many customer engagements. These templates encode common investigation patterns such as chamber matching analysis, drift detection, and excursion screening, allowing engineers to apply proven methodologies with minimal setup.
Lastly, once a new template is defined, engineers can reapply the same analysis to new data with a single click, enabling continuous monitoring of tool and module behavior over time. This turns FDC analysis from a one‑off activity into a repeatable, scalable workflow that fits naturally into daily yield engineering practices.
 Picture 5. Exensio Reusable Template for Future Coming Data
6. How Do FDC and Inline Measurement Complement Each Other in Yield Control?
Inline measurement remains a critical pillar of semiconductor manufacturing. Techniques such as optical metrology, CD‑SEM, overlay measurement, and film thickness monitoring provide essential feedback on whether process results meet design intent. These measurements are indispensable for process development, qualification, and production monitoring.
At the same time, inline measurement has intrinsic limitations, especially as device structures scale and become more complex. Every inline measurement relies on a human‑defined measurement recipe, including illumination settings, optical models, fitting algorithms, and assumptions about the structure being measured. While these recipes are carefully optimized, they inevitably represent a simplified view of a highly complex physical system.
As process conditions evolve, inline measurement results can remain stable even when underlying process behavior changes. In such cases, the measurement reflects what the recipe is sensitive to, not necessarily all changes occurring in the device or material stack.
At advanced technology nodes, this challenge becomes more pronounced. Many yield‑critical structures, such as buried interfaces or active device regions in GAA architectures, are hard to access optically. Inline measurements therefore rely on indirect proxies rather than direct observation of the structures that ultimately determine electrical performance. In addition, many material properties that strongly influence yield, such as stress, composition, resistivity, or interface quality, cannot be directly measured on product wafers with sufficient resolution.
FDC tool trace data addresses these gaps by capturing the actual process conditions inside the equipment during every wafer run. Signals such as pressure, temperature, gas delivery, RF behavior, timing, and chamber state provide continuous visibility into the process environment in which devices are formed, even when critical structures cannot be directly measured.
While inline measurement provides essential feedback on process results, it does not always correlate strongly with yield or electrical test outcomes. Certain yield‑limiting mechanisms are driven by process conditions that are not directly observable through standard inline measurements.
In these cases, FDC tool trace data often shows clearer and stronger correlation with yield and electrical test behavior by reflecting the intrinsic process environment inside the equipment. This allows engineers to trace yield variation back to specific tools, chambers, process steps, and equipment behaviors and to reveal root causes that would otherwise remain hidden when relying on metrology data alone.
7. Why Is a Strong Analysis-Ready FDC Data Platform Fundamental for AI‑Based Analysis?
As fabs explore AI‑based analysis, many discover that the primary challenge is not model selection, but data readiness. In manufacturing environments, AI success depends first on the quality, structure, and consistency of the input data.
AI models do not learn effectively from raw FDC tool traces alone. They rely on well‑defined, physically meaningful indicators that consistently represent process behavior across tools, chambers, and time. If indicators are poorly defined, misaligned with process steps, or inconsistent across equipment, even sophisticated models will produce unstable or uninterpretable results.
This is why indicator quality matters more than model complexity. For AI to be trusted in production, indicators must:
- Reflect real process behavior rather than noise or artifacts
- Be calculated from clearly defined, process‑aware time windows
- Remain stable and comparable across tools, chambers, and recipe versions
- Be interpretable by engineers, enabling validation and root‑cause reasoning
Exensio Process Control is designed with analysis as a primary objective, not just alarm generation. It provides a structured framework for defining, managing, and validating FDC indicators that are suitable for advanced analytics and AI applications. Features such as process‑aware indicator definition, cross‑tool consistency, sensor prioritization ensure that indicators form a stable and trustworthy feature space.
Among manufacturing data sources, FDC tool trace data is particularly well suited for AI when properly structured:
- It is high‑density, captured on every run rather than sampled periodically
- It has a direct connection to process physics
- It includes rich context such as tools, chambers, recipes, and step information
- It is sensitive to early process changes, often before yield impact is visible
Importantly, preparing for AI does not require a radical shift in workflow. Fabs that already define indicators based on process understanding, maintain consistent FDC data collection, analyze trends and correlations, and use FDC in yield investigations are naturally building the foundation for AI and advanced process control.
In this sense, AI is not a replacement for good FDC practice, but as an extension of it. The value of AI increases as the quality and discipline of FDC indicator management improves.
References:
Exensio Process Control Solution
The Evolution of AI Applications for Process Control
The Evolution of AI in Process Control: From Basic SPC to Agentic AI Systems
| Abbreviation | Definition |
| FDC | Fault Detection and Classification |
| ET | Equipment Traces |
| RF | Radio Frequency |
| CD | Critical Dimension |
| e-test | Electrical Test |
| SPC | Statistical Process Control |
| CD-SEM | Critical Dimension Scanning Electron Microscopy |
| GAA | Gate All Around |
| AI | Artificial Intelligence |
| APC | Advanced Process Control |