For Outsourced Semiconductor Assembly and Test companies who are the close partners for the world’s fabless semiconductor companies
This product includes the following three modules: Process Control, Test Operations, and Assembly Operations.
Exensio OSAT collects and aligns data from every aspect of semiconductor test, assembly, and packaging. As with all Exensio products, the product data collected is harmonized and is available in near real-time for OSAT customers for use within their Exensio product environment.
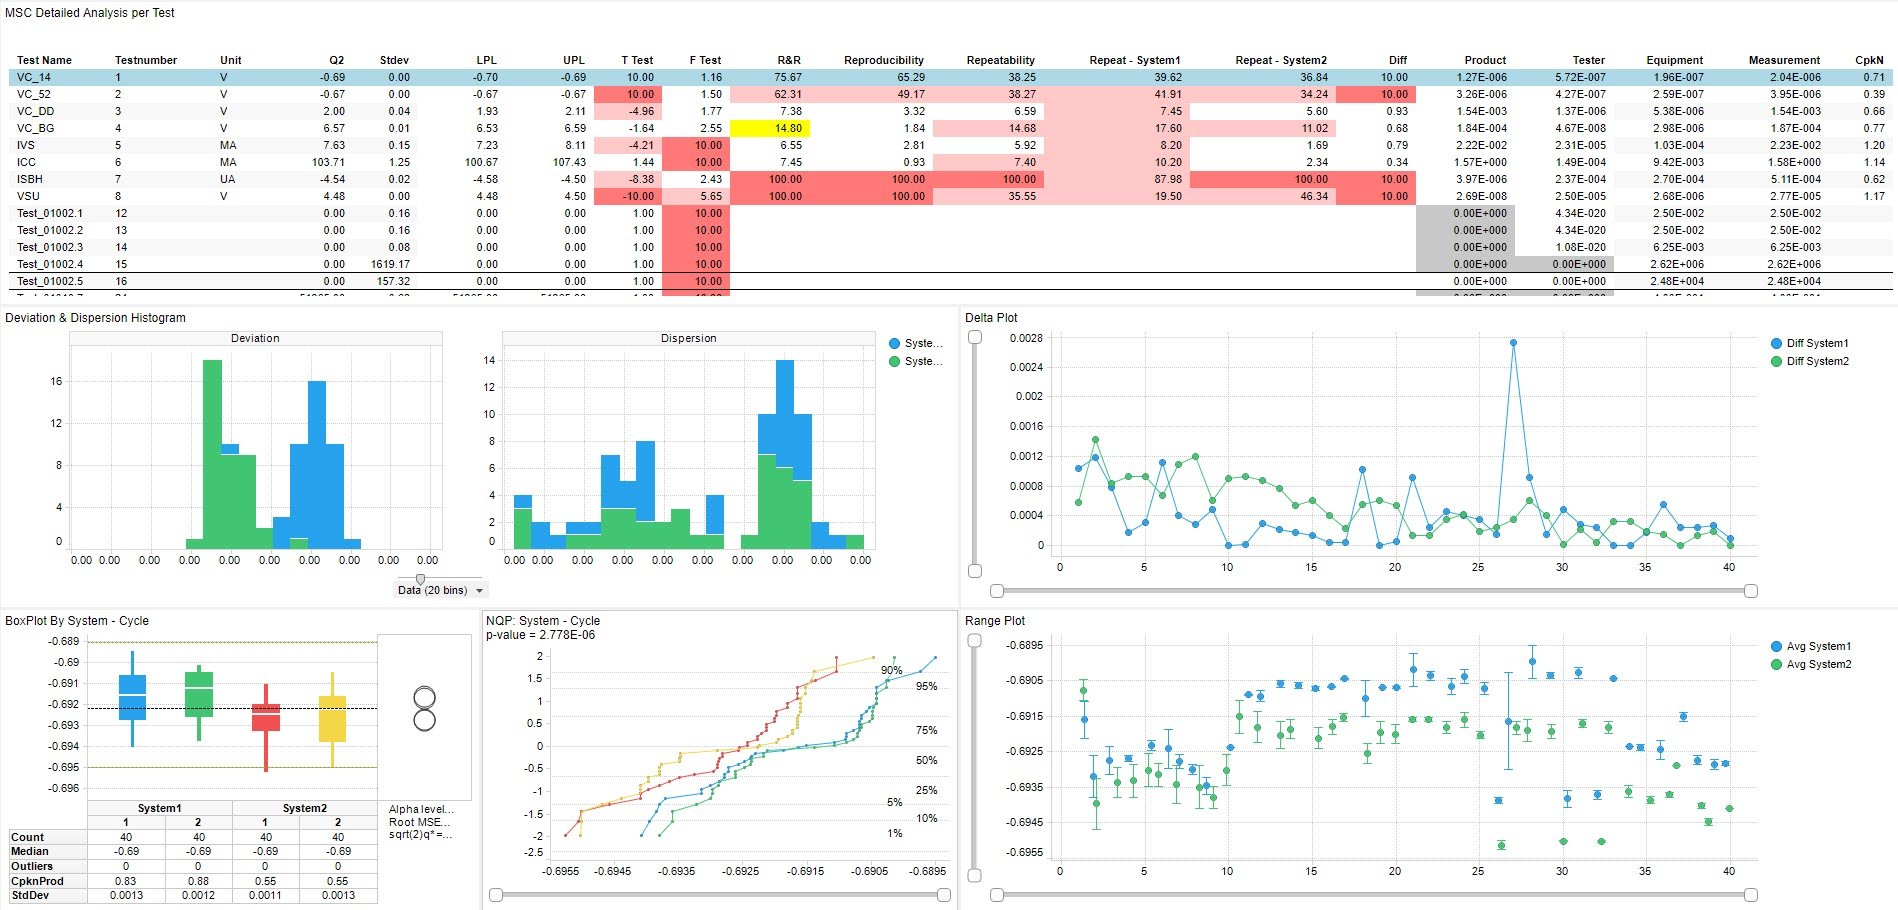
Ensure Test Operations Consistency
A critical business requirement for OSATs is stability within their test operations. Exensio OSAT enables any OSAT to monitor their operational environment for consistency or to quality new equipment. Testers can be compared with Gauge R&R, deviation and dispersion histograms, box plots and more. In the example below, in the delta plot in the right-center, the spike in the chart indicates that a tester is not stable. With this information, test engineers can investigate further to determine if the tester needs a PM.